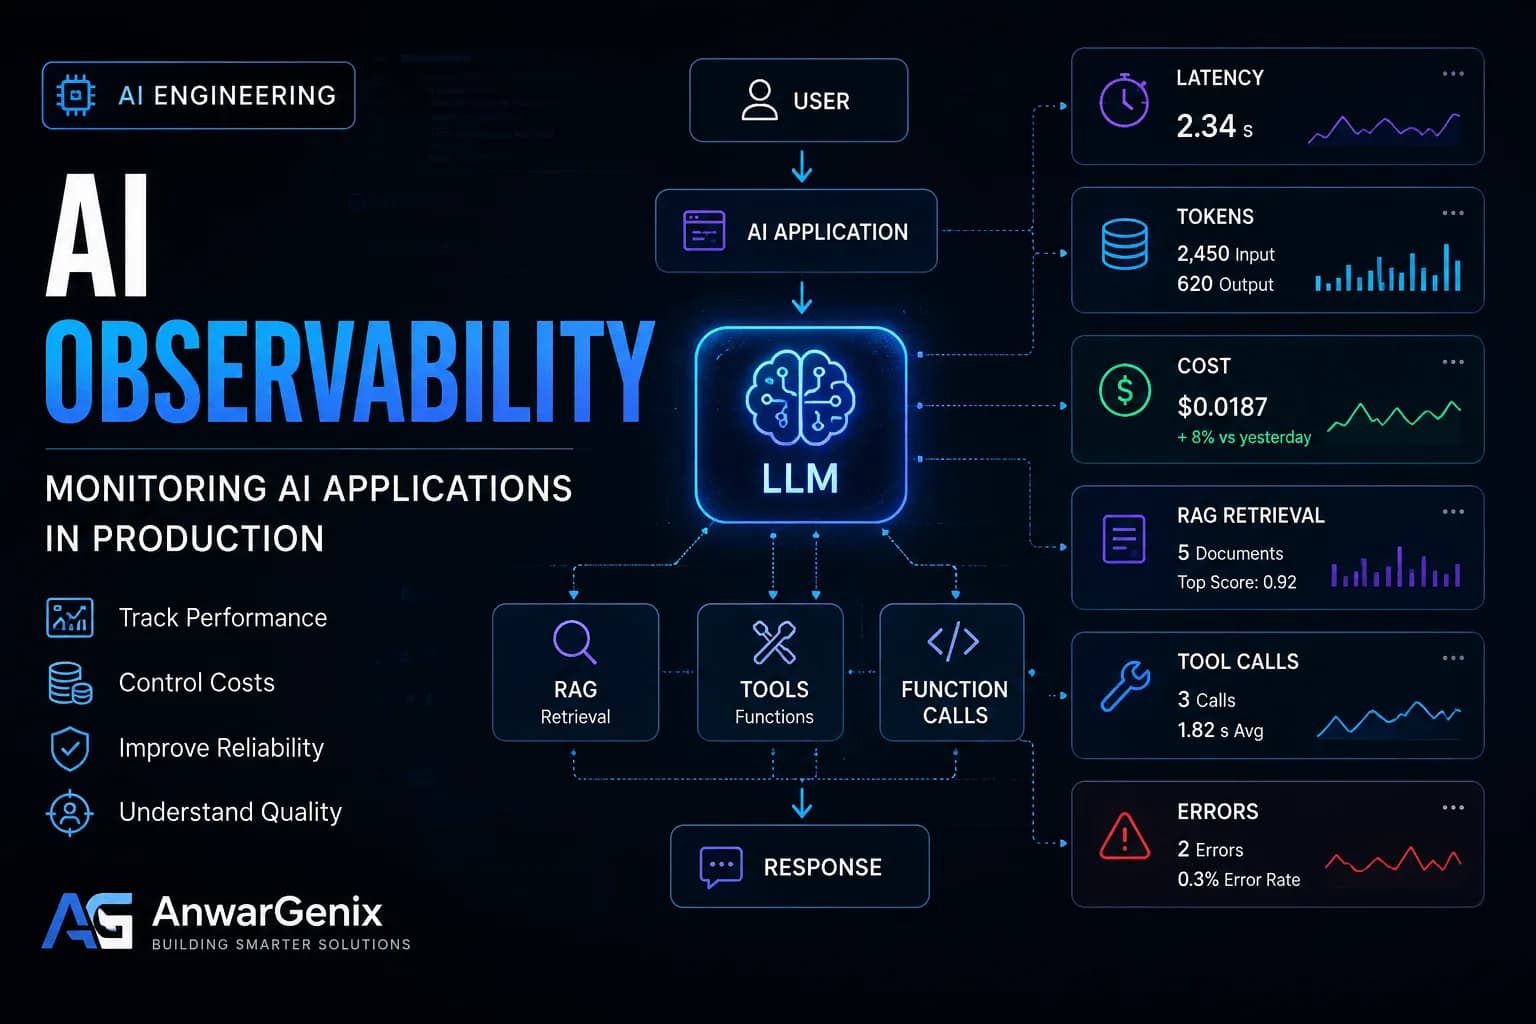
Building an AI-powered application is only the beginning. Once users start interacting with it, developers need to understand what is happening behind every request.
How long did the model take to respond? How many tokens were used? Why did one request cost significantly more than another? Did a tool call fail? Did the RAG system retrieve useful information? Did the application return an incorrect response even though the API request succeeded?
Traditional application monitoring can answer some of these questions, but AI applications introduce another layer of complexity.
A normal web application might be monitored through metrics such as server response time, database queries, CPU usage, memory consumption, and error rates.
An AI application has those same concerns, but it also depends on probabilistic model behavior.
That means a request can technically succeed while still producing a poor result.
This is where AI observability becomes important.
AI observability gives developers visibility into how an AI system behaves across the entire workflow—from the initial user request to the model response, retrieval operations, tool calls, and final application result.
What Is AI Observability?
AI observability is the practice of collecting and analyzing information about an AI application's behavior so developers can understand, debug, and improve the system.
It goes beyond simply checking whether an AI API returned a successful response.
For example, consider an AI-powered WordPress plugin that analyzes articles and generates SEO recommendations.
A traditional monitoring system might tell you:
Request: 200 OK
Response Time: 2.4 seconds
That's useful, but it doesn't tell you much about the AI workflow.
AI observability could reveal:
Request
   │
   ├── Input tokens: 1,840
   ├── Model: selected model
   ├── LLM latency: 1.7s
   ├── Output tokens: 420
   ├── Structured output: valid
   ├── Validation: passed
   └── Total cost: $0.00X
Now the developer has a much clearer picture of what happened.
The application didn't just succeed or fail.
You can see how it succeeded.
Why Traditional Monitoring Isn't Enough
Traditional monitoring works extremely well for many parts of a web application.
You can monitor:
HTTP response codes
Server response time
Database performance
Memory usage
CPU utilization
PHP errors
JavaScript errors
API failures
But AI introduces characteristics that aren't visible through these metrics alone.
Consider two requests to the same AI endpoint.
Both return:
HTTP 200
The first request takes 1.5 seconds and uses 500 tokens.
The second takes 8 seconds and uses 6,000 tokens.
From a traditional monitoring perspective, both requests succeeded.
From an AI engineering perspective, they're very different.
The second request may indicate:
An unnecessarily large prompt
Too much retrieved context
An inefficient workflow
An unexpected number of tool calls
A model producing excessive output
A poorly designed agent loop
Without AI-specific observability, these problems can be difficult to identify.
AI Systems Are Workflows, Not Just API Calls
One of the biggest reasons AI observability matters is that modern AI applications are rarely just:
User → LLM → Response
A production system might look more like:
User
 │
 ▼
Web Application
 │
 ▼
Input Processing
 │
 ▼
RAG Retrieval
 │
 ▼
LLM
 │
 ├── Function Call
 │       │
 │       ▼
 │    External API
 │
 └── Additional Tool
         │
         ▼
      Database
 │
 ▼
Structured Output
 │
 ▼
Validation
 │
 ▼
Final Response
Every stage introduces potential latency, errors, and cost.
If the final response takes eight seconds, simply knowing that the AI request took eight seconds isn't enough.
You want to know where those eight seconds were spent.
Perhaps the model took two seconds.
The database took another second.
The retrieval system took four seconds.
A tool call took one second.
Without tracing these individual operations, optimization becomes guesswork.
The Importance of Latency
Latency is one of the most obvious metrics in AI applications.
Users don't experience tokens, API calls, or model configurations.
They experience waiting.
A simple AI feature might respond in:
1.8 seconds
while a complex agent workflow could take:
12 seconds
The difference may come from multiple sources:
Total Response Time
       │
       ├── Input processing
       ├── RAG retrieval
       ├── LLM generation
       ├── Function calls
       ├── Database queries
       └── Output processing
Observability allows developers to measure each component instead of treating the entire request as one operation.
This is particularly useful when an AI feature becomes slower as it grows.
For example, a WordPress plugin might initially analyze an article in two seconds.
Later, developers add:
The same feature might eventually take eight seconds.
Tracing makes it possible to identify which new operation introduced the additional latency.
Token Usage and AI Costs
Another major difference between AI applications and traditional software is that model usage can directly affect operating costs.
Two requests that perform the same visible task may consume very different amounts of tokens.
For example:
Request A
Input: 1,000 tokens
Output: 300 tokens

Request B
Input: 8,000 tokens
Output: 1,200 tokens
If the second request happens thousands of times per day, the cost difference can become significant.
Observability allows developers to track:
Input tokens
Output tokens
Total tokens
Cost per request
Cost per user
Cost per workflow
Cost by model
This can reveal inefficient patterns.
Perhaps a WordPress plugin is sending the entire post history to the model when only the current article is required.
Or a RAG application is retrieving 20 documents when three would have been sufficient.
Or an AI agent is repeatedly calling the same tool.
Without usage tracking, these problems can remain hidden.
Understanding Model Behavior
AI applications have another challenge that traditional applications don't face in the same way: the model can produce different outputs for similar inputs.
A successful API request doesn't necessarily mean the result was useful.
Imagine a content assistant receives:
"Create a concise meta description for this article."
The API responds successfully.
But the generated description might be:
There is no HTTP error telling you that the response is poor.
This is why AI observability also needs to consider quality signals, not just technical metrics.
Depending on the application, those signals might include:
The goal is to understand not only whether the system worked, but whether it produced a useful result.
Observability for RAG Systems
RAG applications add another important layer to monitor.
A RAG workflow might look like:
User Question
     │
     ▼
Query Processing
     │
     ▼
Vector Search
     │
     ▼
Retrieved Documents
     │
     ▼
LLM
     │
     ▼
Response
Suppose a user asks a question and receives an incorrect answer.
Where did the problem occur?
It could be the model.
But it could also be retrieval.
Perhaps the relevant document wasn't retrieved.
Or the search returned irrelevant documents.
Or too much context was provided.
AI observability can track information such as:
Query
 ↓
Retrieved Documents
 ↓
Similarity / Relevance
 ↓
Context Sent to Model
 ↓
Model Response
This makes it much easier to distinguish between a retrieval problem and a generation problem.
That's particularly important because improving the model won't necessarily fix a poor retrieval pipeline.
Observability for Function Calling
The same principle applies when AI applications use Function Calling.
Imagine an AI assistant receives:
"Check the status of my account."
The model decides to call:
get_customer()
The application then calls an internal API.
The workflow might look like:
User
 │
 ▼
LLM
 │
 ▼
get_customer()
 │
 ▼
CRM API
 │
 ▼
Customer Data
 │
 ▼
LLM
 │
 ▼
Final Response
If the final response takes six seconds, observability should help answer:
How long did the model take?
Which function was called?
How long did the CRM API take?
Did the function fail?
Was the function called more than once?
How many tokens were consumed?
Did the model receive the expected result?
This becomes even more important when an AI agent can call multiple tools.
Observability for AI Agents
AI agents can introduce another level of complexity because they may perform multiple steps before completing a task.
For example:
User
 │
 ▼
Agent
 │
 ├── Search Knowledge Base
 │
 ├── Call CRM
 │
 ├── Analyze Result
 │
 ├── Send Email
 │
 └── Create Task
 │
 ▼
Final Response
If something goes wrong, looking only at the final response won't tell you what happened.
An observability system should allow developers to reconstruct the workflow.
For example:
Trace #82941

Step 1 → Knowledge Search
         0.8s

Step 2 → CRM Lookup
         1.4s

Step 3 → LLM Reasoning
         2.1s

Step 4 → Email Tool
         3.2s

Step 5 → Final Response
         1.1s
Now the slow email operation becomes obvious.
Without tracing, developers might incorrectly assume that the model itself was responsible for the delay.
A Practical WordPress Example
Consider a custom WordPress plugin that provides an AI content assistant.
An editor clicks:
Analyze Article
The plugin performs several operations:
WordPress Editor
       │
       ▼
Plugin API Endpoint
       │
       ▼
Content Extraction
       │
       ▼
AI Model
       │
       ├── SEO Analysis
       ├── Content Classification
       └── Keyword Suggestions
       │
       ▼
Structured Output
       │
       ▼
Validation
       │
       ▼
WordPress Admin UI
Instead of logging only:
AI request successful
the plugin could record useful metrics:
Request ID: 82941
User: 1842
Feature: Content Analysis

Input tokens: 2,450
Output tokens: 520
Model latency: 1.9s
Validation: Passed
Total request: 2.3s
Over time, these metrics can reveal patterns.
Perhaps articles over 5,000 words produce significantly higher latency.
Maybe one particular operation accounts for most of the token usage.
Maybe validation fails for a specific type of content.
This information allows the developer to improve the actual system rather than guessing what might be wrong.
Observability in Web Applications
The same architecture applies to a standalone web application.
Imagine an AI support system:
Customer
   │
   ▼
Frontend
   │
   ▼
Backend
   │
   ▼
AI Workflow
   │
   ├── Classification
   ├── RAG
   ├── CRM Lookup
   └── Response Generation
   │
   ▼
Final Response
The backend can assign a unique request or trace ID to the workflow.
For example:
request_id = "req_82941"
That ID can be associated with every operation.
If a customer reports:
"The AI gave me the wrong answer."
the development team can locate the corresponding trace and inspect:
Input
 ↓
Retrieved Context
 ↓
Model Request
 ↓
Model Response
 ↓
Tool Calls
 ↓
Validation
 ↓
Final Response
This turns an otherwise difficult debugging problem into something much more manageable.
Observability in Automation
Automation systems can benefit from the same approach.
Imagine an automation that processes incoming emails:
Email
 │
 ▼
AI Classification
 │
 ▼
Structured Output
 │
 ▼
CRM
 │
 ▼
Notification
If a workflow suddenly starts sending notifications to the wrong team, developers need to know where the problem occurred.
Was the email classified incorrectly?
Was the structured output wrong?
Did the routing rule change?
Did the CRM return unexpected data?
Tracing the workflow makes these questions easier to answer.
The Goal Is Understanding, Not Just Logging
It's important to distinguish logging from observability.
Logging records events.
Observability helps you understand system behavior by connecting those events and metrics together.
For example:
Logging:
"Function get_customer failed."
is useful.
But:
Trace:
User Request
    ↓
LLM selected get_customer
    ↓
CRM API called
    ↓
CRM returned 500
    ↓
Retry #1
    ↓
Retry #2
    ↓
Fallback response
provides much more context.
The difference becomes especially important as AI workflows become more complex.
Building an Observability Mindset
When designing an AI feature, don't wait until something breaks before deciding what to monitor.
Before launching the feature, ask:
What should we measure?
Where can latency occur?
Which operations can fail?
How much does each request cost?
Which tools can the model call?
How can we evaluate response quality?
What information will help us debug failures?
What sensitive information should never appear in logs?
These questions should be considered during architecture and development, not after deployment.
A well-designed observability layer gives developers the visibility needed to understand the AI system as it evolves.
And as AI applications become more complex, that visibility becomes just as important as the model itself.
In the next section of the article, we'll look more closely at what developers should actually monitor in production, including latency, token usage, cost, model responses, RAG retrieval, Function Calling, errors, retries, and complete AI workflow traces.
What Should You Monitor in an AI Application?
Knowing that AI observability is important is one thing. Knowing what to actually monitor is another.
An AI application can generate dozens of useful signals during a single request. The challenge is deciding which ones matter and connecting them together so that developers can understand the complete workflow.
A useful observability setup should answer four basic questions:
What happened?
How long did it take?
How much did it cost?
Was the result actually useful?
Let's look at the most important signals to track.
Track Every AI Request
The first step is to give every AI workflow a unique identifier.
For example:
$request_id = wp_generate_uuid4();
That ID can then be associated with everything that happens during the request.
Request ID: 7f31...

User Request
    │
    ├── LLM Request
    ├── RAG Retrieval
    ├── Tool Call
    ├── Validation
    └── Final Response
Without a shared request ID, logs from different parts of the application can become disconnected.
With one, you can reconstruct what happened.
For a WordPress plugin, you might record:
Request ID: 7f31...
User ID: 1842
Feature: AI Content Analysis
Started: 10:42:18
Completed: 10:42:21
Status: Success
The exact information you store depends on your application and privacy requirements, but having a consistent identifier is one of the foundations of useful AI tracing.
Monitor LLM Latency
Latency should be measured at the model level as well as the complete application level.
For example:
Total request:       4.2s
LLM generation:      2.1s
RAG retrieval:       0.8s
Database query:      0.4s
Output processing:   0.3s
Other:               0.6s
Now you can see that the model isn't necessarily responsible for most of the delay.
A common mistake is to measure only:
Frontend → Backend → Response
That tells you the user experienced 4.2 seconds of latency, but not why.
Instead, measure individual stages.
Conceptually:
$start = microtime(true);

$result = call_ai_model($prompt);

$llm_latency = microtime(true) - $start;
You can use the same pattern around retrieval, external APIs, database queries, and tool execution.
This creates a timing breakdown for the entire workflow.
Monitor Token Usage
Tokens are another important metric because they affect both performance and cost.
For every model request, track information such as:
Input tokens
Output tokens
Total tokens
For example:
Input:  2,400
Output:   580
Total:   2,980
Now imagine the same WordPress plugin processes 5,000 articles every month.
If the average request uses 3,000 tokens, the application processes approximately:
5,000 × 3,000 = 15,000,000 tokens
That gives you a much better understanding of the scale of the system.
Token usage can also reveal inefficient prompts.
If a feature only needs a short piece of content but consistently sends thousands of tokens to the model, there may be an opportunity to reduce context.
Monitor Cost
Token usage becomes particularly useful when combined with pricing information.
Instead of looking only at total monthly API spending, break costs down by:
Feature
Model
User
Request
Workflow
Organization
Environment
For example:
AI Content Analysis
Requests: 8,200
Tokens: 24.6M
Cost: $XX.XX

AI Chat Assistant
Requests: 31,400
Tokens: 82.1M
Cost: $XXX.XX
Now you can see which features actually consume your AI budget.
This can lead to practical optimization decisions.
Perhaps a simple classification task is using a more expensive model than necessary.
Or perhaps an agent is making several model calls when one would be sufficient.
Observability makes these patterns visible.
Monitor the Model Being Used
Applications often use more than one model.
For example:
Simple classification → Smaller model
Complex reasoning     → More capable model
Embeddings             → Embedding model
Tracking the model for every request helps you understand how your application is using different models.
It also becomes valuable when you change models.
Suppose your application moves from:
Model A
to:
Model B
You can compare:
Latency
Token usage
Cost
Error rate
Quality
before and after the change.
Without historical observability data, it's much harder to determine whether the change actually improved the system.
Trace RAG Retrieval
If your AI application uses RAG, monitoring the model alone isn't enough.
You should also observe the retrieval stage.
For example:
User Question
      │
      ▼
Query
      │
      ▼
Vector Search
      │
      ▼
Top 5 Documents
      │
      ▼
LLM
Useful retrieval metrics can include:
Retrieval latency
Number of documents retrieved
Search query
Similarity scores where applicable
Document identifiers
Number of documents passed to the model
Suppose the system retrieves five documents:
Document A → 0.91
Document B → 0.88
Document C → 0.43
Document D → 0.38
Document E → 0.31
That might tell you something important about retrieval quality.
If users frequently receive poor answers and the retrieved documents have weak relevance, the problem may be the retrieval pipeline rather than the language model.
Don't Send Sensitive RAG Data to Logs
RAG observability requires an important privacy consideration.
Tracking document IDs can be useful.
Storing the complete contents of every retrieved document may not be.
Imagine a private knowledge base containing:
Customer Contracts
Employee Records
Internal Policies
Financial Documents
If you store all retrieved content in your logs, you've potentially created another location containing sensitive information.
A safer approach may be to record:
Request ID
Document IDs
Retrieval count
Retrieval latency
Relevance information
while keeping the actual document content out of general-purpose logs unless there is a strong reason to retain it.
Observability should improve visibility without unnecessarily expanding your data exposure.
Monitor Function Calls
Function Calling creates another useful observability point.
Suppose an AI application has these tools:
search_customer()
get_order()
create_ticket()
send_email()
You should be able to see which tool was requested and how it performed.
For example:
Request: 7f31...

Tool: get_order
Arguments: order_id=4521
Execution: 340ms
Result: Success
If the model calls the same tool repeatedly, that's also useful information.
For example:
get_order()
get_order()
get_order()
get_order()
Four identical calls may indicate an inefficient agent workflow.
Perhaps the model isn't receiving the result correctly.
Perhaps the application isn't preserving context.
Perhaps the agent needs a maximum tool-call limit.
Without tool-level observability, these problems can be difficult to diagnose.
Monitor Tool Errors
A tool call can fail even when the LLM request itself succeeds.
Consider:
LLM → CRM API → 500 Error
The model isn't necessarily the problem.
The CRM might be unavailable.
Your observability system should therefore distinguish between different types of failures.
For example:
LLM Error
Tool Error
Database Error
Retrieval Error
Validation Error
Authentication Error
Timeout
This makes troubleshooting much easier.
Instead of seeing:
AI request failed
you can see:
AI request completed
CRM tool failed
HTTP 500
Retry attempted
Fallback response returned
That is much more actionable.
Monitor Retries
Retries can be useful when external services temporarily fail.
But excessive retries can become a problem.
Imagine:
Request
 ↓
Tool fails
 ↓
Retry
 ↓
Tool fails
 ↓
Retry
 ↓
Tool fails
 ↓
Retry
Now a single user request has created multiple API calls.
That increases latency and potentially increases cost.
Track:
Retry count
Retry reason
Retry latency
Final result
This allows developers to determine whether retries are helping or simply hiding an underlying problem.
A production system should also define reasonable retry limits.
Monitor Structured Output Validation
If your application uses Structured Outputs, track whether the generated result passes validation.
For example:
Request
   │
   ▼
LLM
   │
   ▼
Structured Output
   │
   ▼
Validation
   │
   ├── Passed
   │
   └── Failed
You might discover:
Total requests:       10,000
Validation passed:     9,700
Validation failed:       300
A 3% failure rate may deserve investigation.
Perhaps the schema is unnecessarily complicated.
Perhaps the prompt needs improvement.
Perhaps a particular type of user input causes problems.
The important point is that without tracking validation failures, you may not even know that the issue exists.
Monitor AI Response Quality
Technical metrics are important, but they don't answer the most important question:
Did the AI actually provide a useful result?
Quality is harder to measure than latency or token usage because it depends on the application.
Possible signals include:
User Feedback
Allow users to indicate whether a response was useful.
👍 Helpful
👎 Not helpful
Human Review
For higher-risk applications, reviewers can evaluate selected outputs.
Automated Evaluation
You can periodically test responses against a predefined evaluation dataset.
Business Outcomes
Sometimes the best metric is what happens after the response.
For example:
AI recommendation
      ↓
User accepts
      ↓
Workflow completed
A recommendation that users consistently reject may indicate a quality problem even if every technical metric looks healthy.
Monitor the Complete AI Trace
Individual metrics are useful, but tracing brings them together.
Consider this request:
Trace: req_82941

09:12:01  Request received
09:12:01  Input validation passed
09:12:01  RAG search started
09:12:02  5 documents retrieved
09:12:02  LLM request started
09:12:04  Function call: get_customer
09:12:05  Tool completed
09:12:06  LLM request completed
09:12:06  Structured output validated
09:12:06  Response returned
Now developers can understand the entire lifecycle of the request.
This is especially valuable when working with agents, where one request may involve many operations.
WordPress Example: Logging an AI Workflow
Consider a custom WordPress plugin with an AI content assistant.
A simplified logging function might look like:
function log_ai_event( $request_id, $event, $data = [] ) {

    error_log(
        wp_json_encode([
            'request_id' => $request_id,
            'event'      => $event,
            'timestamp'  => current_time('mysql'),
            'data'       => $data,
        ])
    );
}
The plugin could then record events:
log_ai_event(
    $request_id,
    'ai_request_started'
);
After the model responds:
log_ai_event(
    $request_id,
    'ai_request_completed',
    [
        'latency' => $latency,
        'tokens'  => $total_tokens,
    ]
);
And after validation:
log_ai_event(
    $request_id,
    'output_validation',
    [
        'status' => 'passed',
    ]
);
This is only a simplified example.
For production systems, developers should generally use a proper logging and monitoring system rather than relying exclusively on PHP's error log.
The important concept is the trace:
request_id
     │
     ├── AI request
     ├── Retrieval
     ├── Tool call
     ├── Validation
     └── Final response
Observability for Automation Workflows
Automation platforms can apply the same principles.
Imagine:
Incoming Email
      │
      ▼
AI Classification
      │
      ▼
Structured Output
      │
      ▼
CRM Update
      │
      ▼
Notification
A useful trace could record:
Workflow ID: 82941

AI Classification: 1.2s
Tokens: 1,340
Classification: billing
Confidence / evaluation: accepted

CRM Update: 0.8s
Status: success

Notification: 0.4s
Status: success

Total: 2.4s
Now if the automation becomes slower or starts failing, developers can identify which stage changed.
Don't Measure Everything Just Because You Can
It's possible to collect an enormous amount of telemetry.
That doesn't necessarily make the system better.
Start with metrics that answer real engineering questions.
For most AI applications, a useful baseline includes:
Request count
Latency
Token usage
Cost
Errors
Retries
Tool calls
RAG retrieval
Validation results
User feedback
Then add more metrics as the application becomes more complex.
The objective isn't to create the biggest dashboard.
It's to create a dashboard that helps you make better decisions.
From Metrics to Action
The real value of observability comes from using the information to improve the system.
Suppose your monitoring shows:
Average latency: 7.2s
RAG retrieval: 4.1s
LLM generation: 2.2s
Everything else: 0.9s
The obvious optimization target is retrieval.
Or perhaps you discover:
Average tokens: 7,800
for a task that should only require a few thousand tokens.
That suggests the context or prompt may be unnecessarily large.
Or you discover:
Tool calls per request: 6.8
for an operation that normally requires one or two calls.
Now you have evidence that the workflow needs improvement.
This is the real purpose of AI observability.
Measure → understand → optimize.
Building AI Observability Into the Architecture
At this point, the overall architecture starts to look like this:
                         User
                           │
                           ▼
                    AI Application
                           │
                           ▼
                    ┌─────────────┐
                    │ AI Workflow │
                    └──────┬──────┘
                           │
              ┌────────────┼────────────┐
              ▼            ▼            ▼
             RAG          LLM         Tools
              │            │            │
              └────────────┼────────────┘
                           ▼
                       Validation
                           │
                           ▼
                        Response

                           │
                           ▼
                  Observability Layer
                           │
        ┌──────────────────┼──────────────────┐
        ▼                  ▼                  ▼
      Traces            Metrics             Logs
        │                  │                  │
        ├── Latency        ├── Tokens         ├── Errors
        ├── Tool Calls     ├── Cost           ├── Events
        ├── Retrieval      ├── Requests       └── Status
        └── Workflow       └── Quality
The observability layer doesn't change what the AI is supposed to do.
It gives developers visibility into how the system is actually behaving.
That distinction becomes increasingly important as AI applications move from simple chat interfaces to systems capable of retrieval, tool use, automation, and autonomous decision-making.
In the final section, we'll bring everything together and look at how to design production-ready AI observability, including privacy-aware logging, alerting, monitoring AI agents, cost optimization, quality evaluation, common mistakes, and the metrics that are actually worth tracking.
Building Production-Ready AI Observability
AI observability becomes most valuable when an application moves beyond experimentation and starts handling real users, real data, and real workloads.
At that stage, simply collecting logs isn't enough. Developers need to understand how the entire AI workflow behaves over time, identify problems before they become widespread, and determine whether changes to prompts, models, retrieval systems, or application logic actually improve the product.
A production-ready observability strategy should therefore focus on three areas:
Visibility
   ↓
Understanding
   ↓
Action
You need enough visibility to understand what happened, enough context to determine why it happened, and enough information to decide what should change.
Build Tracing Into the AI Workflow
The first step is connecting the different operations belonging to the same request.
Consider an AI-powered WordPress plugin that analyzes an article:
Request
  │
  ├── Extract WordPress content
  │
  ├── Retrieve related content
  │
  ├── Call LLM
  │
  ├── Validate structured output
  │
  └── Return recommendations
Each operation can generate its own logs and metrics.
Without a common trace ID, these events may look like unrelated records.
With one:
Trace ID: req_82941

├── Content extraction
├── RAG retrieval
├── LLM request
├── Structured output validation
└── Final response
the complete workflow can be reconstructed.
This becomes particularly important with AI agents, where a single user request can trigger several model calls and tool executions.
Monitor AI Agents Differently
An agent isn't simply one request followed by one response.
It may perform several operations:
User
 ↓
Agent
 ↓
Search
 ↓
LLM
 ↓
CRM Tool
 ↓
LLM
 ↓
Email Tool
 ↓
LLM
 ↓
Final Response
For this type of workflow, observability should capture the sequence of events.
For example:
Trace: 82941

Step 1
Tool: search_documents
Duration: 620ms

Step 2
LLM generation
Duration: 1.8s

Step 3
Tool: get_customer
Duration: 430ms

Step 4
LLM generation
Duration: 1.6s

Step 5
Tool: send_email
Duration: 920ms
Now developers can see how the agent reached its final result.
More importantly, they can identify inefficient behavior.
If an agent starts making ten tool calls for a task that normally requires two, the problem becomes visible.
Set Alerts for Meaningful Failures
Monitoring only becomes useful when someone can act on the information.
A production AI system should have alerts for important conditions.
For example:
High error rate
        ↓
Alert

Latency spike
        ↓
Alert

Unexpected cost increase
        ↓
Alert

Tool failure rate increases
        ↓
Alert

RAG retrieval quality drops
        ↓
Alert
You don't need an alert for every individual failure.
A single failed AI request may be normal.
A sudden increase from a 1% error rate to 15% is much more significant.
The goal is to identify meaningful changes in system behavior rather than create an endless stream of notifications.
Monitor Cost Before It Becomes a Problem
AI costs can grow quickly as usage increases.
Imagine an application that initially processes:
100 requests/day
The cost may seem insignificant.
After the feature becomes popular:
10,000 requests/day
The economics are very different.
Observability allows you to understand where the money is going.
For example:
Feature                 Daily Requests    Daily Cost

Content Analysis            4,200            $X
AI Chat                     3,800            $X
Document Extraction         1,500            $X
AI Automation                 500            $X
You can then optimize the most expensive workflows first.
Possible optimizations include:
Reducing unnecessary context
Using smaller models for simple tasks
Caching repeated results
Reducing unnecessary model calls
Limiting agent tool calls
Avoiding duplicate retrieval
Processing large tasks asynchronously
Cost optimization becomes much easier when you can see exactly where costs originate.
Track Quality, Not Just Technical Performance
An AI system can be technically healthy and still provide poor results.
For example:
API success rate: 99.9%
Average latency: 2.1s
Those numbers look excellent.
But if users consistently reject the generated responses, the application still has a problem.
This is why production AI observability should include quality signals.
Depending on the application, you might track:
For a WordPress content assistant, you could track whether editors accept or modify AI-generated suggestions.
For a customer support application, you could measure whether users resolve their issue without escalation.
For an automation system, you could measure how often humans need to correct AI-generated classifications.
The most useful quality metric is often specific to the application's actual goal.
Detect Changes After Model or Prompt Updates
AI applications are frequently changed.
Developers may modify:
Any of these changes can affect application behavior.
Suppose a developer updates a prompt on Monday.
On Tuesday, observability shows:
Before update

Average tokens: 2,100
Validation failures: 1.2%
Latency: 2.4s

After update

Average tokens: 4,700
Validation failures: 6.8%
Latency: 4.9s
The new prompt may have introduced unnecessary context or changed the model's behavior.
Without historical data, developers may not notice the regression.
With observability, the difference becomes measurable.
Be Careful With Logs and Privacy
AI observability creates an important privacy challenge.
Developers naturally want detailed information for debugging.
But AI requests can contain sensitive data.
For example:
Customer name
Email address
Private documents
Internal business information
Financial information
Logging every prompt and response indefinitely may create unnecessary privacy and security risks.
A better approach is to decide what information is actually required.
Instead of storing the complete request, you may only need:
Request ID
User ID
Model
Token count
Latency
Tool name
Status
Error type
If content must be logged for debugging, consider redaction, access restrictions, retention limits, and appropriate handling of sensitive fields.
Observability should increase visibility without creating unnecessary data exposure.
Separate Development and Production Telemetry
The amount of information useful during development isn't always appropriate for production.
During development, you might want detailed information about:
Prompts
Retrieved documents
Model responses
Tool arguments
Intermediate results
Production environments may need more restrictive logging.
For example:
Development
→ Detailed debugging

Production
→ Minimized telemetry
→ Redacted sensitive data
→ Controlled access
→ Defined retention
This distinction is especially important when an AI system processes customer or internal business data.
Use Sampling for High-Volume Applications
A large AI application may generate millions of events.
Recording every single detail can become expensive and difficult to manage.
Sampling can help.
For example:
Normal requests
→ Record essential metrics

Successful routine traces
→ Sample a percentage

Errors
→ Capture detailed traces

High-latency requests
→ Capture detailed traces
This gives developers detailed information about unusual behavior without storing enormous amounts of telemetry.
The exact sampling strategy depends on the application, but the principle is simple:
Capture more information when something unusual happens.
Don't Confuse Correlation With Causation
Observability tells you what happened around an event, but developers still need to investigate why.
Suppose monitoring shows:
Latency increased
at the same time that:
Token usage increased
That doesn't automatically prove that token usage caused the latency increase.
There could be another factor:
A slower model
Increased retrieval time
External API latency
Server load
Network problems
Observability provides evidence.
Developers still need to reason about the underlying cause.
This is one reason complete traces are more useful than isolated metrics.
Common AI Observability Mistakes
There are several mistakes worth avoiding.
Monitoring only API errors
A successful API response can still contain poor or incorrect information.
Tracking only total latency
Total latency doesn't tell you which part of the workflow is slow.
Ignoring token usage
A feature can become significantly more expensive without producing obvious technical errors.
Not tracing tool calls
Agent workflows can become difficult to debug when tool execution isn't visible.
Logging sensitive information
Detailed logs can unintentionally become a source of data leakage.
Collecting too many metrics
A huge dashboard isn't necessarily useful. Track metrics that answer real questions.
Ignoring quality
Technical reliability and response quality are different dimensions.
No historical comparison
Without historical metrics, it becomes difficult to determine whether a model, prompt, or architecture change improved the system.
What Should You Actually Monitor?
For many production AI applications, a practical baseline looks like this:
Area                               Useful Metrics

Requests            Request count, success rate, failure rate
Latency             Total latency, LLM latency, tool latency, retrieval latency
Models              Model used, model errors
Tokens              Input, output, total
Cost                Cost per request, feature, user, workflow
RAG                 Retrieval count, latency, relevance
Tools               Calls, failures, execution time
Agents              Steps, tool calls, retries, execution time
Outputs             Validation failures, quality signals
Users               Feedback, acceptance, escalation
Security            Blocked requests, authorization failures
You don't necessarily need all of these on day one.
Start with the metrics that matter most to your application and expand the observability layer as the system becomes more complex.
AI Observability Is a Continuous Feedback Loop
The real value of observability isn't the dashboard itself.
It's the feedback loop it creates.
Build
  ↓
Deploy
  ↓
Observe
  ↓
Identify Problems
  ↓
Improve
  ↓
Deploy Again
For example, you might discover that your RAG system retrieves too many documents.
You reduce the retrieval set.
Then you observe:
Token usage ↓
Latency ↓
Cost ↓
But perhaps response quality also decreases.
Now you have another piece of information.
Maybe three documents were optimal instead of one.
This is how AI systems should be developed: through measurement and iteration rather than assumptions.
AI Observability Is Part of AI Engineering
As AI applications become more sophisticated, observability shouldn't be treated as an optional monitoring feature added after deployment.
It should be considered during architecture.
If your application uses:
LLM
RAG
Function Calling
Structured Outputs
AI Agents
External APIs
Automation
you should already be thinking about how you'll observe those components.
A production AI system should make it possible to answer:
What happened?
Why did it happen?
How much did it cost?
How long did it take?
Was the result correct?
What changed?
What should we improve?
These questions are at the heart of AI observability.
Final Thoughts
AI applications introduce a different kind of engineering challenge.
Traditional monitoring can tell you whether your server is running, whether an API returned an error, or whether a database query became slow.
But an AI system can return a perfectly valid response while still producing the wrong answer, retrieving poor context, making unnecessary tool calls, consuming excessive tokens, or generating an unexpectedly expensive workflow.
That's why observability needs to extend beyond infrastructure.
Developers need visibility into the AI layer itself.
For a WordPress plugin, that might mean understanding how long content analysis takes, how many tokens each article consumes, and whether editors accept the generated recommendations.
For a web application, it could mean tracing a complete customer-support workflow across an LLM, RAG system, and CRM.
For an automation platform, it could mean tracking how AI classifications translate into downstream actions.
The specific metrics will vary, but the principle remains the same:
You can't reliably improve an AI system if you can't see how it behaves.
AI observability provides that visibility.
It connects model behavior, application performance, costs, retrieval, tools, and user outcomes into one picture—giving developers the information they need to build AI systems that are not only functional, but measurable, debuggable, and continuously improvable.